

A network outage rarely begins with every system going dark. Network monitoring continuously tracks devices, traffic, and performance, then alerts teams to warning signs such as rising latency, errors, or unusual usage. That early visibility is central to how network monitoring prevents outages: teams can investigate issues before they interrupt work.
When systems slow down or connections fail, employees can lose access to the tools and information they need. It’s reasonable to want visibility into what’s happening across your network before a small fault becomes a major disruption. This article explains what network monitoring tracks, how alerts support response, and how performance and configuration insights contribute to reliable operations. You’ll also see how monitoring fits into a broader approach to reducing downtime and maintaining business continuity.
Key Takeaways
- See how SNMP, ICMP, and NetFlow provide different views of network status and traffic.
- Understand why monitoring routers, switches, firewalls, servers, and applications helps pinpoint trouble.
- Learn how centralized configuration records and tuned alarm settings can help teams spot risky changes.
- Explore how redundancy, backup power, and practiced response plans support business continuity.
- Identify when remote IT support and security services can help strengthen network operations.
What is Network Monitoring?
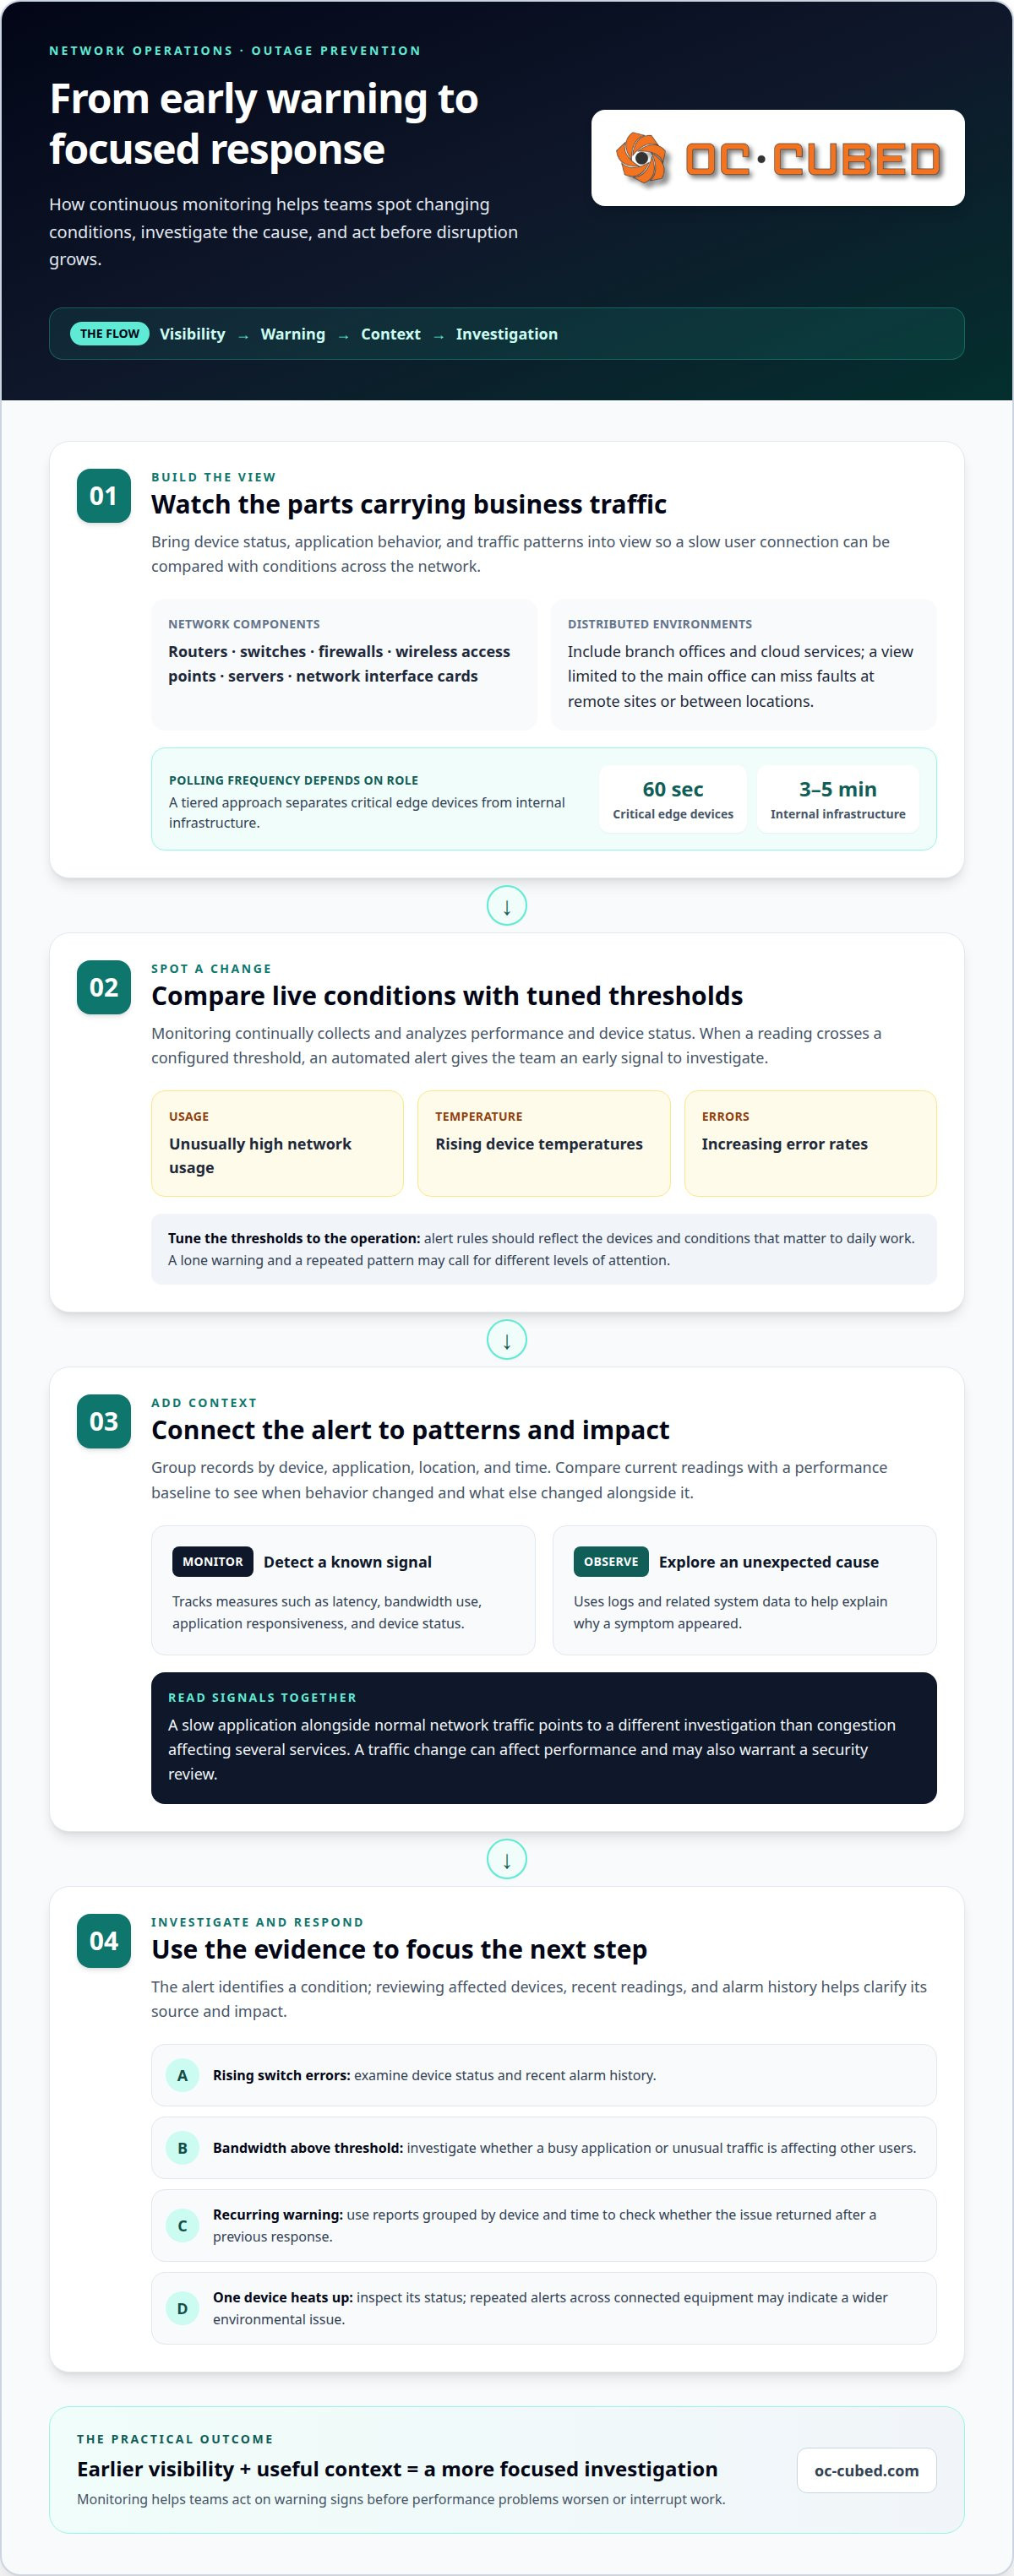
Network monitoring continuously collects and analyzes information about network performance and device status. Understanding how network monitoring prevents outages starts with spotting early changes before they interrupt business applications.
Proactive Alerts and Thresholds
Proactive monitoring compares network conditions with configured thresholds and sends automated alerts when readings cross them. For example, an administrator can set alerts for unusually high network usage, rising device temperatures, or increasing error rates. These signals help teams investigate before performance problems worsen or equipment is damaged. Thresholds should reflect the devices and conditions that matter to daily operations.
Alert rules can also distinguish an isolated warning from a pattern needing attention. If one device reports a temperature increase, the team can inspect its status; repeated alerts across connected equipment may point to a wider environmental issue. Reviewing the affected devices and recent readings gives administrators a practical starting point for investigation.
Monitoring Tools and Reports
Monitoring tools scan network conditions, report device status, and notify administrators about detected problems. Teams can review alarm history to spot recurring faults, such as repeated temperature warnings on one device. These reports turn separate incidents into patterns that can support proactive maintenance. Clear records also provide useful context when administrators investigate a new alert or decide what needs attention first.
For example, recurring errors on the same switch warrant a closer look than a single brief warning. A report that groups alerts by device and time helps teams see whether the problem has returned after a previous response. That record can guide follow-up maintenance and help determine whether the original issue was resolved.
Monitoring and Observability
Network monitoring tracks known measures, while observability uses system data to help explain unexpected problems. For example, an alert might show that a server is responding slowly; logs and related performance data can help identify the cause. Monitoring signals that something needs attention. Observability helps teams examine the conditions behind it and choose a focused response.
The distinction matters when a familiar metric shows a symptom but not its source. If a server slows while network performance appears normal, administrators can examine application logs and related system data for clues. Understanding how network monitoring prevents outages means detecting a warning and having enough context to investigate it.
Alerts work best when they connect a signal to a practical response. If a switch reports rising errors, an administrator can examine its status and recent alarm history. If bandwidth usage exceeds a set threshold, the team can investigate whether a busy application or unusual traffic is affecting other users. The alert identifies a condition; follow-up analysis helps clarify its impact.
Network visibility across devices, processes, performance, applications, and traffic
Network visibility brings device status, application behavior, and traffic patterns into one view. This context helps teams connect a user’s slow connection with a wider network issue.
Active Monitoring and Application Performance
Active network monitoring regularly checks network components and performance, while application performance management tracks how those conditions affect the software people rely on. Teams can compare latency, bandwidth use, and application responsiveness to find where delays begin. For example, if a cloud application slows while other services respond normally, the investigation can focus on its connection path rather than every device.
Performance and Security Monitoring
Performance monitoring measures service health, including latency, traffic, bandwidth, and device status. Security monitoring looks for suspicious activity and potential threats, such as unusual traffic patterns that warrant investigation. These views can inform each other: a sudden traffic change might affect performance and signal a security concern. Treating them as distinct but related helps teams choose an appropriate response.
Baselines and Root Cause Analysis
A performance baseline records typical network behavior, giving teams a reference point when metrics change. Comparing current latency or bandwidth use with that baseline can reveal when a problem started and which devices or applications changed at the same time. This narrows root cause analysis: a slow application alongside normal network traffic calls for a different investigation than congestion across several services.
Visibility needs to cover the parts that carry business traffic. Routers, switches, firewalls, wireless access points, servers, and network interface cards each provide information about network conditions. For a company with branch offices and cloud services, a view limited to its main office can miss a fault affecting a remote site or a connection between locations. Monitoring distributed environments brings those signals together for comparison.
Monitoring frequency should reflect the role of each component. In a tiered approach, critical network edge devices can be polled every 60 seconds, while internal network infrastructure can be polled every 3-5 minutes. These intervals create a practical distinction between equipment whose failure could affect external connectivity and internal components with different operational roles.
Network performance data can grow quickly because devices produce logs and metrics continuously. Teams can group information by device, application, location, and time to make patterns easier to interpret. If a switch’s status changes alongside increased latency for several applications, that shared timing gives investigators a useful lead. A focused review supports faster diagnosis than treating every metric as an isolated alert.
For teams that need an ongoing view of device health and network behavior, network monitoring and configuration can support that visibility.
Centralized configuration and alarm notifications
Network outages can follow faulty configuration changes, hardware failures, software bugs, or damaged network cables. According to the Uptime Institute, configuration or change management processes are the most frequent cause of network outages.
Configuration Failures and Outage Risks
Configuration management tracks network settings and changes so teams can identify risky edits before they disrupt operations. A mistaken firewall rule can block legitimate traffic, while a routing change can send traffic along the wrong path. Network configuration tools can track changes in real time, alert teams to suspicious behavior, and roll back configurations when anomalies occur.
Centralized configuration records give administrators one place to review settings across network devices and locations. For example, if a branch office loses connectivity after a routing change, the team can compare its configuration with earlier records. That comparison helps isolate what changed instead of treating the incident as an unexplained hardware failure.
Change management matters because network settings interact. A firewall rule may affect access to an application, while a switch setting can alter how devices communicate. Recording each change, its timing, and the affected equipment gives operations teams a clearer path to diagnose failures. Configuration history can also help distinguish a software issue from a recent settings adjustment.
Cloud Monitoring and Alarm Notifications
Centralized monitoring can bring information from network sites and cloud environments into a shared view. Teams can review configuration details, site status, and alarms together, then investigate a change alongside its effect on connectivity. For example, if a cloud service becomes unreachable after a network update, related alarms and change records can help narrow the investigation.
Alarm settings should reflect changing network conditions. A new cloud application or modified firewall rule may shift normal traffic, so teams need to review thresholds and alarm history. This helps reduce false alerts while preserving notifications about unusual changes, failed devices, or rising error rates that require attention.
Common issues monitoring can help detect include configuration errors, failing network hardware, software instability, and connectivity loss linked to an external provider or damaged cable. Monitoring can reveal warning signs such as device failures, changing error rates, or unreachable network equipment, helping administrators investigate the affected systems.
Centralized alarm views also help teams distinguish a local incident from a wider disruption. If one site reports a failed switch while other sites remain reachable, the evidence points to a local fault. If several locations lose access to the same external service, teams can examine shared connectivity and provider status instead.
After an alert, administrators can compare its timing with configuration records, device status, and affected locations. This sequence helps establish whether a change preceded the incident and which systems need attention. Consistent records support a focused response and help prevent repeated configuration mistakes from disrupting network operations.
Reducing downtime and improving business continuity
A network outage is an unexpected disruption to connectivity, service, or functionality across some or all of an organization’s network. Alerts help teams identify incidents sooner, while response plans and redundant systems help limit the operational impact.
Outage Impact and Business Costs
When a network outage blocks access to business applications, employees may lose crucial information and customer transactions can stop. A failed connection can also interrupt communications between offices, suppliers, and customers. The effects depend on which systems become unavailable and how much daily work relies on them.
That figure illustrates why organizations need to understand which services are most critical. If a payment application fails, for example, customer transactions may stop even while email remains available.
Alerts and Automated Remediation
Alerts notify teams when monitoring detects conditions that may lead to downtime, giving them an opportunity to investigate and act. Some remote monitoring systems can use preprogrammed control relays to command managed equipment. For example, a system may switch on a generator during a commercial power outage or activate air conditioning after a high-temperature alarm.
Automation applies only to equipment and responses configured for those actions. An alert can still reduce delays when a person must investigate, because it identifies the affected device or condition. A failed switch alert, for instance, gives the team a clear starting point instead of leaving them to search the entire network.
Continuity planning adds steps that monitoring alone cannot provide. An IT contingency plan should identify how to restore systems and whom to inform when an incident occurs. Organizations can use multiple internet connections, backup devices, failover switches, or an uninterruptible power supply to reduce reliance on a single connection or power source.
Redundancy is most useful when teams know how it behaves during a failure. Test backups and practice failover procedures so staff understand the sequence for switching services and communicating changes. For example, a business can rehearse moving essential traffic to a secondary connection, then record any problems discovered during the exercise.
After each outage, document its duration, affected services, and resolution. An incident record can show whether the disruption involved a provider, hardware failure, or power loss. Reviewing these records helps teams refine response plans and identify recurring risks. Severe weather can affect external connectivity, so redundant network paths may also support continuity during regional disruptions.
SNMP, ICMP, and NetFlow protocols
Network monitoring tools use protocols to collect different views of infrastructure status. SNMP, ICMP, and NetFlow help teams examine device health, reachability, and traffic activity.
SNMP and Flow-Based Monitoring
SNMP gathers information from network devices, while flow-based monitoring summarizes traffic moving through routers and switches. Network monitoring commonly uses SNMP to collect device data, and NetFlow records IP traffic statistics from enabled interfaces. Together, these methods help teams see both equipment status and how traffic uses network capacity.
For example, SNMP data can show whether a router or switch is responding and report performance metrics. NetFlow can show which interfaces carry traffic and how usage patterns change. If an office application becomes slow, comparing device status with traffic records helps teams assess whether congestion or a device issue may be involved.
The Internet Engineering Task Force developed IPFIX in 2013 to enable IP traffic data collection. IPFIX and NetFlow are associated with flow records, which provide a summarized view of traffic rather than a separate account of every user action. That view can help teams compare traffic patterns across interfaces and identify unexpected changes.
Each method has a different focus. SNMP helps describe device conditions; flow data helps explain traffic movement. Using both gives administrators more context than relying on a single status signal. For instance, a switch may remain online while its interface carries unusually heavy traffic, a distinction that can guide an investigation.
ICMP and WMI Monitoring
ICMP helps monitoring systems test whether network devices respond, while WMI can provide information about Windows systems. Network monitoring commonly uses ICMP to check reachability. A successful response indicates that a device can be reached, while no response gives administrators a reason to investigate connectivity, device status, or the network path.
ICMP checks answer a simple question: can the monitoring system reach a router, server, or other device? They don’t explain every cause of a failed response. Pairing the result with SNMP status or NetFlow traffic information gives teams additional evidence to assess where an incident may originate.
WMI adds a view of Windows computer status and system information. For example, an administrator investigating an unreachable Windows server can compare its reported system condition with ICMP reachability and network-device data. Each source answers a different question, helping teams avoid treating a single signal as a complete diagnosis.
Choosing protocols based on the infrastructure improves visibility and efficiency. SNMP can supply device information, ICMP can indicate reachability, and NetFlow can summarize traffic. WMI can contribute Windows system details. Together, these signals help administrators decide what to examine next when network performance changes.
OC Cubed - Your trusted MSP: Remote IT Support
OC Cubed helps businesses connect network visibility with practical IT support. If your team needs help interpreting monitoring findings, responding to security concerns, or maintaining user systems, OC Cubed’s Remote IT Support and Network Monitoring and Configuration can provide a clear path forward.
Ongoing protection also matters. Security Threat Detection and Remediation and Endpoint Protection / Antivirus help address threats affecting business systems, while Microsoft 365 Tenant Maintenance supports the environment employees use every day. These services complement network monitoring by covering related areas of business IT.
For a conversation about your business’s IT needs, contact OC Cubed or visit oc-cubed.com.
Build a steadier path forward
Understanding how network monitoring prevents outages is a starting point. The next step is to turn network signals into clear ownership: who reviews an alert, who assesses its impact, and how teams record the response. That structure helps make monitoring part of everyday operations, rather than a dashboard no one acts on.
As your systems and business needs change, review whether your monitoring approach still gives teams the visibility they need. OC Cubed - Your trusted MSP offers Remote IT Support, Microsoft 365 Tenant Maintenance, and Security Threat Detection and Remediation to support related IT needs. These services can fit into a broader effort to keep business systems managed and protected.
With clear monitoring and a considered response process, your team can manage network operations with greater control.
Frequently Asked Questions
How Does Network Visibility Prevent Network Outages?
Network visibility helps teams identify which systems are affected and where disruption begins. For example, if staff at one branch can’t reach a shared application but other sites can, administrators can focus on that branch’s connection rather than investigate every office. Clear views of devices, locations, and service dependencies help teams direct response efforts and recognize when a local fault may affect a business-critical service.
How does network monitoring detect problems before an outage?
Monitoring detects warning signs by collecting device and performance data, then comparing readings with configured thresholds or expected patterns. A rising error rate on a switch, for instance, can prompt investigation before users lose access. Reviewing the alert alongside nearby device and service status helps teams determine whether the signal points to an isolated issue or a wider incident that needs prompt attention.
What network metrics should be monitored to prevent outages?
Track latency, bandwidth use, traffic levels, error rates, and device status because each can reveal a different kind of strain. Add temperature, power input, and battery condition for equipment where environmental or power problems could interrupt service. Prioritize metrics tied to essential business applications. For example, a payment system may depend on low latency and stable connectivity, while a file server may need close attention to device health.
How does network monitoring help identify bottlenecks and capacity issues?
Monitoring helps locate bottlenecks by showing where traffic, latency, or errors rise along the network path. Compare performance during a busy period with quieter intervals, then check which interfaces and applications changed together. If one connection becomes heavily used while other network links remain steady, the issue may lie on that path. This evidence helps teams distinguish a capacity constraint from a separate device or application fault.
How much downtime can proactive network monitoring prevent?
There’s no fixed amount, because the result depends on the cause of the outage, how early monitoring detects a warning, and how quickly teams act. An alert about a deteriorating device may allow intervention before service stops. Monitoring can’t eliminate every risk, such as a sudden cable cut or an external provider failure, but clear incident information can help teams investigate and restore affected services more efficiently.
What tools and protocols are used for network monitoring, such as SNMP and NetFlow?
Common monitoring methods include SNMP for device information, ICMP for reachability checks, and NetFlow for summarized IP traffic statistics. Each provides a different view. For example, ICMP can indicate whether a router responds, while flow data can show how traffic uses its interfaces. Combining signals helps administrators interpret alerts with more context than a single protocol provides.
What are the risks and limitations of network monitoring?
Monitoring can miss problems when important devices or network paths aren’t covered, and poorly tuned alerts can overwhelm teams with noise. It reports conditions but doesn’t fix every underlying cause. A damaged underground cable or an external provider outage can still interrupt connectivity. Teams should review coverage, investigate recurring alerts, and maintain response plans so monitoring information leads to useful action.
How should organizations set up network monitoring and alert thresholds?
Start by identifying critical applications, their supporting devices, and the conditions that could interrupt them. Set thresholds for relevant signals, such as rising errors or excessive bandwidth use, and assign an owner to each alert type. Then review alert history as the network changes. For example, adding a cloud application may shift traffic patterns, so teams should tune thresholds to keep notifications meaningful.

Article by
Peter Irizarry
Peter Irizarry founded OC Cubed, LLC in 2023 to help small to mid-sized businesses stop worrying about downtime and cybersecurity threats. A frequent speaker on SMB digital transformation, Peter is passionate about translating complex IT roadmaps into plain-English business growth strategies. He resides in North Texas with his family.


