

One hour of downtime can cost a 20-employee U.S. business thousands of dollars in lost productivity and sales. Calculating the cost of IT downtime means adding lost revenue and employee productivity losses, then including recovery expenses that apply to the outage. The right estimate depends on how long systems are unavailable and how much work the disruption stops.
Revenue alone rarely captures the full impact of IT downtime. Staff may be unable to serve customers, complete orders, or access essential tools, and recovery work can add further costs. A useful estimate makes these effects visible without treating an industry benchmark as your company’s exact loss.
This guide explains how to choose a calculation method, estimate revenue and staff productivity losses, and account for outage scope and recovery costs. You’ll see how assumptions shape the result and why a quick estimate can differ from a fuller assessment. A clearer view of potential impact can help you make informed decisions about the systems and support your business depends on.
Key Takeaways
- Choose a calculation method that reflects how the outage affects your operations, not just a broad industry benchmark.
- Separate lost sales or production from wages paid for work employees couldn’t complete.
- Use employee count, annual revenue, operating hours, and the affected systems to make your estimate more relevant to your business.
- Account for differences in outage impact: the same disruption can affect teams and industries in very different ways.
- Compare calculation methods to understand which assumptions most influence your downtime estimate.
How do you calculate downtime costs?
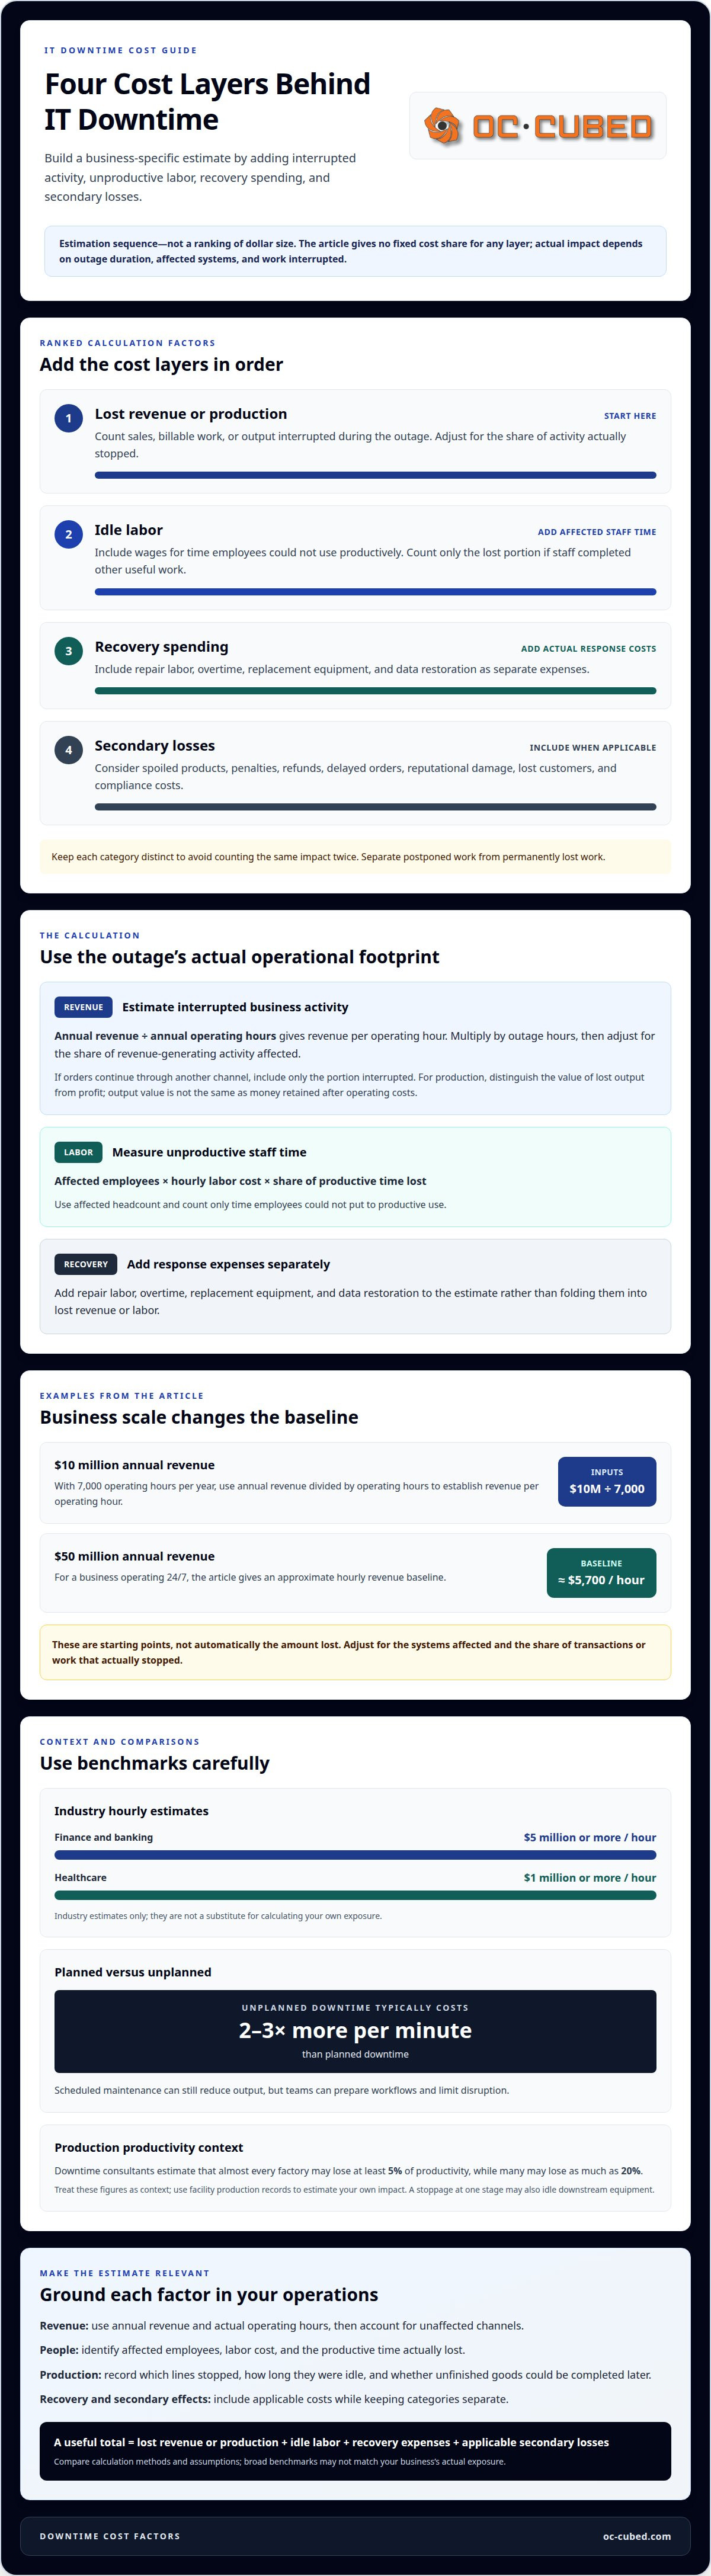
Estimate downtime costs by adding lost revenue, idle labor, recovery spending, and secondary losses. Then compare the total with benchmarks for your industry and business size.
Direct and Indirect Cost Categories
Direct costs are immediate losses; indirect costs emerge as the outage disrupts later work. Both matter because a software failure can affect more than sales during the interruption.
Start with lost revenue or production, then add wages for unproductive time, repair work, and recovery expenses. Include spoiled products, contractual penalties, and customer refunds when applicable. Indirect losses may include delayed orders, reputational damage, or customers choosing another supplier. Compliance costs may also arise if an incident disrupts required business processes. Keep each category distinct to avoid counting the same impact twice.
Downtime Costs Across Industries
Hourly costs vary with business size, industry, and how much work depends on technology. Industry estimates put finance and banking downtime at $5 million or more per hour, compared with $1 million or more for healthcare.
These are benchmarks, not a substitute for calculating your own exposure.
Revenue, Recovery, and Productivity Losses
Estimate revenue loss by dividing revenue across operating hours, then multiplying by the outage duration and the share of activity affected. To estimate staff costs, multiply affected employees by their hourly labor cost and the share of productive time lost.
Add recovery costs separately, including repair labor, overtime, replacement equipment, and data restoration.
Planned and Unplanned Outage Costs
Unplanned downtime typically costs 2-3 times more per minute than planned downtime. A scheduled maintenance window can still reduce output, but teams can prepare workflows and limit disruption.
Compare prevention and disaster recovery spending with the losses an outage could cause. For disaster recovery, weigh the resources needed against likely lost revenue, idle labor, product loss, penalties, and restoration time. The estimate is useful when its assumptions reflect your actual exposure.
Lost revenue and employee productivity calculations
Estimate revenue per operating hour, then adjust it for the outage’s actual effect. Add the value of work employees could not complete to account for productivity losses.
Lost Revenue Per Downtime Hour
Lost revenue per hour estimates sales or billable work interrupted during an outage. Annual revenue alone can hide how much activity depends on systems being available, so this measure helps make that exposure clearer.
For a starting estimate, divide annual revenue by annual operating hours. One example uses $10 million in revenue and 7,000 operating hours per year to establish revenue per operating hour. Multiply that figure by outage hours, then adjust for the share of revenue-generating activity actually stopped. If orders continue through another channel, include only the affected portion. This produces a more useful estimate than treating all hourly revenue as lost.
These examples show how business scale affects exposure. Base your calculation on actual transactions rather than assuming either benchmark matches your business.
Production Revenue and Profit Losses
Production loss measures the value of output a facility could not produce during downtime. Distinguish production value from profit: output value is not the same as the money retained after operating costs.
For example, a manufacturing estimate values lost production at $1,000 per hour. To estimate profit loss instead, use the gross profit tied to the missed output, rather than counting the full sales value as profit. This distinction helps owners compare the outage’s contribution impact with its top-line effect.
Factories should also account for bottlenecks. A stoppage at one production stage can idle downstream equipment, even if that equipment remains operational. Record which lines stopped, how long each remained idle, and whether unfinished goods could be completed later. Downtime consultants estimate that almost every factory may lose at least 5% of productivity, while many may lose as much as 20%. Treat these as context, then use your facility’s production records.
Staff time is another measurable factor. Multiply affected headcount by hourly labor cost and the share of time lost. If employees complete other useful work during the outage, count only the unproductive portion. This avoids overstating labor costs while still capturing reduced productivity.
Separate postponed work from permanently lost work. Delayed orders may shift revenue into a later period, while canceled orders represent a lasting loss. Record both categories independently, then compare them with actual sales and payroll data. To connect these estimates with broader IT planning, review your IT support approach.
Downtime cost by employee count and annual revenue
Employee count and annual revenue show different aspects of outage exposure. Use both to estimate lost business activity and the staff capacity affected.
Start with revenue per operating hour: divide annual revenue by the hours your organization operates annually. Then adjust the figure for the share of revenue-generating work interrupted. A company generating $50 million annually and operating 24/7 earns roughly $5,700 per hour. That is a baseline, not necessarily the revenue lost during an outage. Sales may continue through unaffected channels, while a critical system failure can stop most transactions.
Employee count provides a separate measure of productivity impact. Estimate how many workers were affected, their hourly labor cost, and the share of work they could not complete. A larger workforce can mean more idle labor, but headcount alone does not predict the total. A small sales team relying on one unavailable application may face a different impact from a larger organization with workarounds. Record affected roles and systems, not just total employees.
RTO and RPO affect different parts of the estimate. Recovery time objective (RTO) is the target for restoring service, so it influences how long revenue and staff productivity remain affected. Recovery point objective (RPO) concerns how much recent data the business can afford to lose, which affects potential data reconstruction and recovery work after an outage.
Annual losses provide context, but they shouldn’t replace a company-specific calculation. Unplanned outages cost Global 2000 companies a combined $600 billion per year, while the average organization loses $300 million in revenue per year from unplanned outages. Financial services organizations average $72 million in direct outage-related revenue losses per year. These figures describe broad exposure, not an individual organization’s likely loss.
Choose a revenue base that fits your operation. A retailer may track transactions that could not be completed; a manufacturer may value output that production systems prevented. In either case, separate delayed revenue from permanently lost sales. This prevents a temporary backlog from inflating the estimated loss.
A breach can create recovery work and business disruption beyond the original outage. Keep these costs separate from hourly revenue and payroll estimates, then combine affected revenue, idle labor, and incident-related recovery costs. Comparing the total across systems helps identify which outage scenarios create the greatest financial exposure.
Estimated productivity drop during an outage
Estimate productivity loss by identifying affected employees, interrupted tasks, and outage duration. Then translate the work that could not be completed into financial impact.
Estimating Productivity Loss
Productivity loss measures work employees could not complete during an outage. It matters because systems may remain partly available even while essential tasks slow or stop.
Group employees by role and affected workflow. For each group, estimate the share of productive time lost, then multiply it by affected hours and labor cost. A network failure might prevent sales staff from accessing customer records while accounting work continues. Use separate assumptions for each team rather than one company-wide productivity estimate.
Downtime consultants estimate that almost every factory may lose at least 5% of productivity because of downtime, while many factories may lose as much as 20%. Treat those figures as context, then identify your own bottlenecks. Compare completed work, production logs, or support records from the outage period with normal operations. Note work completed later, work abandoned, and tasks unaffected by the disruption.
Estimating Financial and Revenue Loss
A financial estimate combines reduced output and interrupted revenue with the cost of restoring normal work. Estimating each category separately shows which assumptions drive the total.
For revenue, use a range that reflects your organization’s actual results instead of relying on an industry-wide average. Build lower, middle, and upper scenarios from the revenue sources affected by the outage. Convert each scenario into hourly revenue using your operating schedule. Apply the affected share of activity and outage duration, and record the assumptions alongside each figure.
For productivity, use affected employees’ wages and estimated lost work time. Don’t treat every employee as fully idle if some tasks continued. Add lost output or delayed work only when it represents a distinct loss, not the same labor impact counted twice. This separation makes the final estimate easier to explain and revise.
Duration matters at the minute and hourly level. A short disruption during a peak sales period may affect more revenue than a longer outage during quiet operations. Compare transaction records, production schedules, and employee workflows to understand that difference. Then add recovery costs separately, so the productivity estimate doesn’t conceal the work required to restore service.
Compare scenarios rather than presenting one figure as exact. If the productivity drop is uncertain, show how the total changes under different assumptions. Keep the outage duration, affected roles, revenue range, and recovery costs visible. This record helps decision-makers understand the estimate and update it as operating conditions change.
Choosing a downtime cost calculation method
The best method depends on what an incident interrupts and what decision the estimate needs to support. Compare approaches using the same outage duration and cost categories.
A revenue-based method suits systems that directly support sales, transactions, or production. An employee-based method fits interruptions that leave staff unable to work. A process-based method helps when one failure blocks a critical workflow, such as order fulfillment or customer support. Choose the method that reflects the main operational impact, then add distinct costs without counting them twice.
Use a consistent incident record to compare methods. Capture the affected system, outage start and end, teams affected, delayed work, and recovery activity. Monitoring records can help establish when failures began and when service returned. Pair those timestamps with transaction, payroll, or production records. For example, a payment outage calls for transaction data, while a scheduling system failure calls for records of affected employee tasks.
Next, test the estimate against uptime requirements. An organization with a 99.99% uptime SLA is allowed 52 minutes and 36 seconds of downtime per year. That figure describes permitted unavailability, not its financial impact. Apply your chosen method to the actual business processes affected during that period. A short outage during a critical workflow may matter more than longer downtime in a nonessential system.
- Revenue method: Use interrupted sales or output when transactions stop.
- Labor method: Use affected employees and lost work time when productivity falls.
- Composite method: Combine revenue, labor, recovery, and other distinct losses.
For a major incident, a composite estimate usually gives decision-makers a fuller view. Keep each component visible, including assumptions about affected activity and recovery time. Compare the result with a narrower revenue-only estimate. If the difference is large, identify which additional category drives it. This shows why you chose the method rather than hiding the reasoning in one total.
Match the method to the decision. Budget planning needs a repeatable estimate across incidents; disaster recovery planning needs a view of operational and data restoration impacts. Review assumptions after failures or process changes. Consistent monitoring and records make future estimates easier to compare and help teams see whether uptime improvements address the losses that matter most.
OC Cubed - Your trusted MSP: Remote IT Support
OC Cubed - Your trusted MSP helps businesses address IT issues that disrupt employee work and business systems. Remote IT Support can assist when staff encounter technology problems, while Microsoft 365 Tenant Maintenance supports the systems employees use to communicate and work.
Security Threat Detection and Remediation and Endpoint Protection / Antivirus address security risks that can interrupt operations. These services are relevant when downtime estimates point to recurring IT problems, vulnerable endpoints, or interruptions tied to Microsoft 365. Reviewing the affected systems and business impact can help clarify where ongoing IT management fits into a plan to reduce disruption.
Contact OC Cubed - Your trusted MSP to discuss your business’s IT support needs.
Turn your downtime estimate into a practical plan
A downtime estimate is most useful when it informs a clear operating decision. Use it to identify which systems deserve attention, which business processes depend on them, and what information your team should capture during an incident. Revisit assumptions as workflows change so your planning stays grounded in current operations.
Calculating the cost of IT downtime can also help frame a focused conversation about business continuity. OC Cubed - Your trusted MSP offers Remote IT Support, Microsoft 365 Tenant Maintenance, and Security Threat Detection and Remediation to help businesses address technology issues and security risks that can disrupt work. The right next step is to connect your exposure estimate with the systems and processes that matter most to your organization.
A clearer plan helps your team respond with greater control and stay focused on the work that moves the business forward.
Frequently Asked Questions
How Much Is Downtime Costing You?
Your downtime costs depend on the systems affected, outage duration, and business activity interrupted. To estimate them, examine a specific incident and compare operational records from that period with normal activity. Review sales that failed to complete, work delayed, and recovery tasks required. Separate confirmed losses from possible future effects. This creates a traceable estimate rather than a figure based only on a broad benchmark.
How much does IT downtime cost by company size?
Estimates vary with company size and dependence on IT. These ranges provide context, not a prediction for a particular incident. The operations affected and outage duration determine how closely a company’s losses match a benchmark.
How much does IT downtime cost, according to industry research?
ITIC’s 2024 survey found that over 90% of mid-size and large enterprises estimated an hour of downtime costs more than $300,000. In that survey, 41% of enterprises reported costs of $1 million to $5 million or more per hour. Those figures describe respondents’ estimates, not a standard charge for every outage. Use them to understand potential exposure, then assess which business functions your own incident disrupted.
What is the cost of IT downtime for small businesses in 2026?
A quick estimate can use the upper figure, but your actual loss depends on which systems and revenue activities stop. A business that can accept orders but cannot process payments faces different exposure from one unable to access its sales channel. Apply the estimate to the affected period, then refine it using transaction and payroll records.
How do you calculate the cost of IT downtime?
For a practical estimate, total the revenue impact, lost employee capacity, recovery expenses, and other distinct incident costs. Calculating the cost of IT downtime also means separating delayed activity from sales or work permanently lost. A postponed order may still generate revenue later, while a canceled order may not. Record each assumption beside its cost category so you can update the estimate as the outage timeline or business impact becomes clearer.
What costs should be included in an IT downtime cost estimate?
Include interrupted revenue or production, unproductive employee time, recovery labor, and expenses directly tied to restoring operations. Add costs such as spoiled goods or customer penalties when they occur. Keep indirect effects, such as possible future customer loss, separate from confirmed expenses. Link each item to evidence, such as an invoice, canceled order, or work log. This makes the estimate easier to explain and reduces the risk of counting a loss twice.
How do you estimate employee productivity costs during an outage?
Estimate employee productivity costs by identifying affected roles, disrupted time, and work employees could not complete. Account only for the portion of time that was genuinely unproductive. Staff may, for example, switch to offline tasks while a shared application is unavailable. Count lost capacity, not all scheduled hours. Compare team work records with normal output, and keep wages distinct from lost sales to avoid counting the same impact twice.
How do you calculate indirect costs such as reputational damage and customer churn?
Estimate indirect effects by tracking customer behavior after the incident and comparing it with normal patterns. Review complaints, canceled accounts, delayed renewals, and abandoned purchases, then assess which changes are reasonably connected to the outage. A customer who contacts support during an incident may still remain; a cancellation is a clearer measurable outcome. Keep observed losses separate from projected reputational effects, and document assumptions behind any forecast.

Article by
Peter Irizarry
Peter Irizarry founded OC Cubed, LLC in 2023 to help small to mid-sized businesses stop worrying about downtime and cybersecurity threats. A frequent speaker on SMB digital transformation, Peter is passionate about translating complex IT roadmaps into plain-English business growth strategies. He resides in North Texas with his family.


